You can find the Investor Presentation here
What is Samsara, symbol IOT?
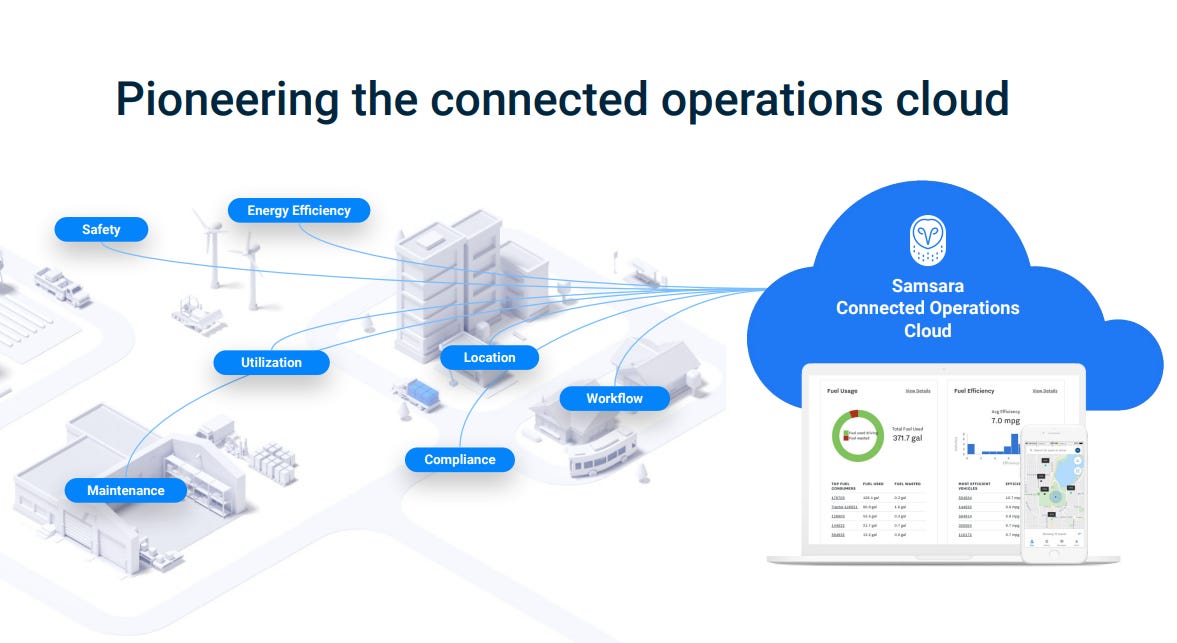
According to the stock price in Google Sheets, they are “Leading the Digital Transformation of Physical Operations” and on a mission to “increase the safety, efficiency, and sustainability of the operations that power the global economy”
Awesome, but what does that mean?
Basically, they transform physical operations data into actionable insights to save time and money. For example, GP Transco used Samsara to reduce idling by 35%, saving an estimated 205,000 gallons of fuel. UFP Industries estimates they saved $600,000 annually in operational and administrative costs by going paperless with Samsara.
And make no mistake, physical operations play a major part of our everyday lives. From transportation to construction, agriculture to manufacturing, physical operations make up roughly 40% of our Gross Domestic Product. This is different from the results we see in its stock price in Excel results.
Efficiency draws a lot of attention from this space. And the transition to connected physical operations seems to be early right now.

How do they do it?
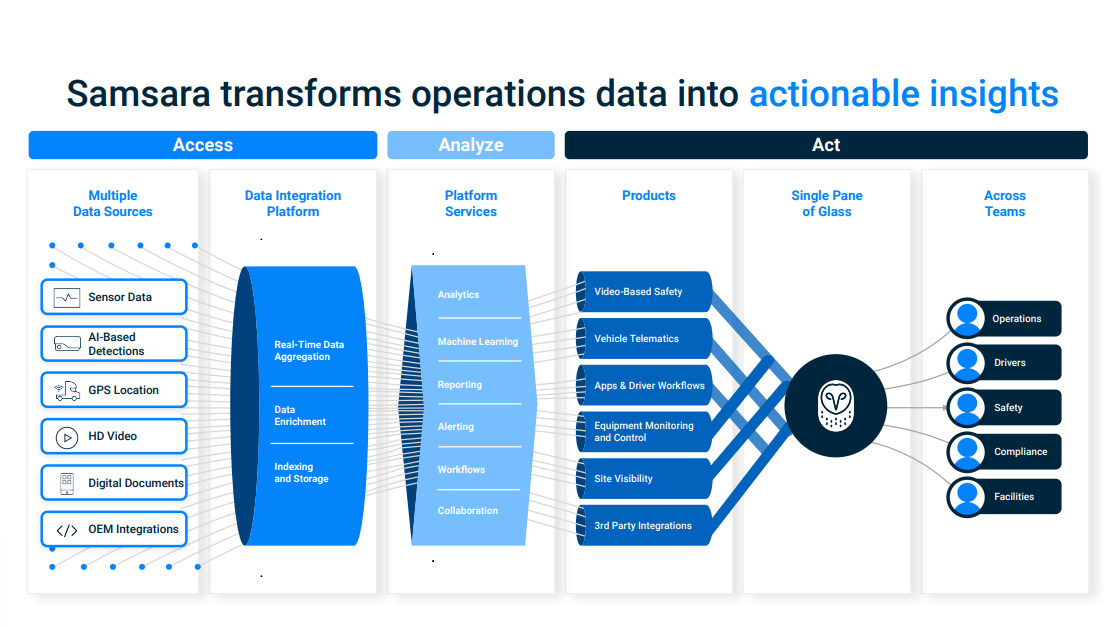
Primarily through their “Access, Analyze and Act” process. Their platforms allows companies to gather data form sensors, GPS locations, video etc and analyze it. Through their products, which have helped to boost the stock price in Excel, they can transmit the data across teams for better decision making.
Seems pretty straightforward, but are people buying it?
Fundamentals
It appears they have some solid brand name customers across multiple industries and companies, most of which have high stock price in Excel
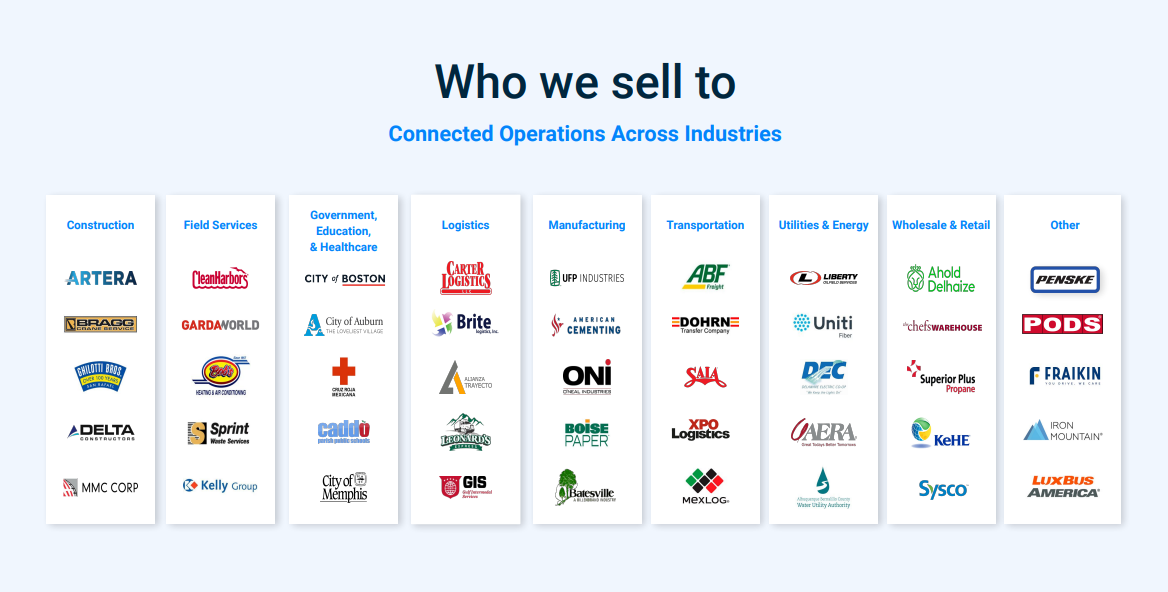
Along with a nice mix of clients from a wide variety of industries, they are adding large customers at quite a fast clip
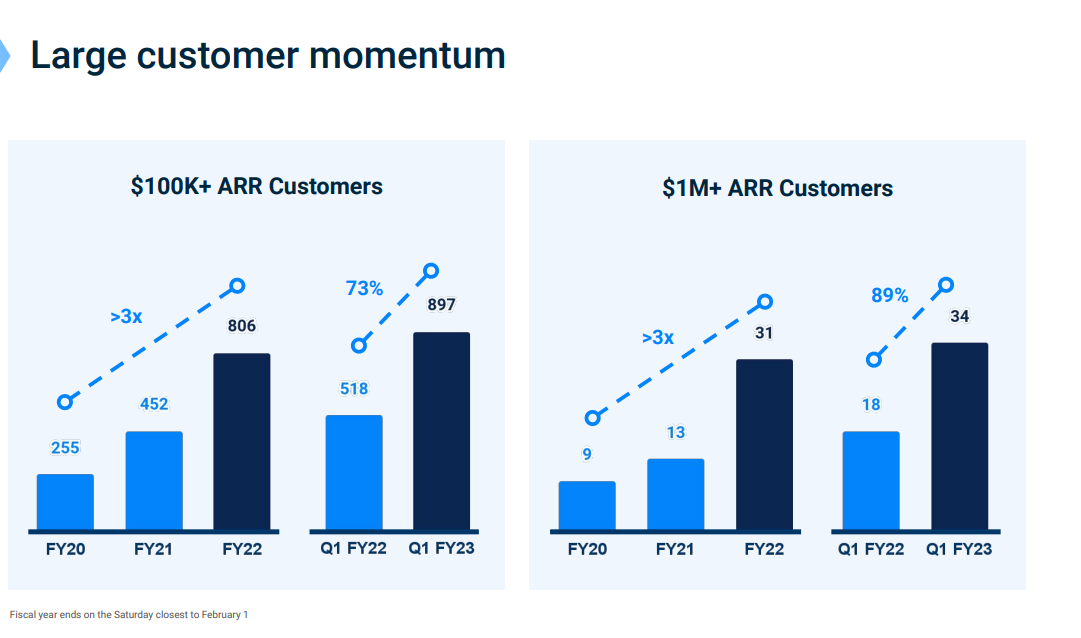
And according to Finnhub Stock Api, although they are not profitable yet ( a big yet) their revenue growth should not be ignored.

In the investor deck, they also speak about their high gross margins (70% or so) and how Multi-product customers are expanding platform breadth. Both are important and affect the company's short squeeze potential equally.
But what do the charts say?
Technically speaking
There is a lot to like on this chart
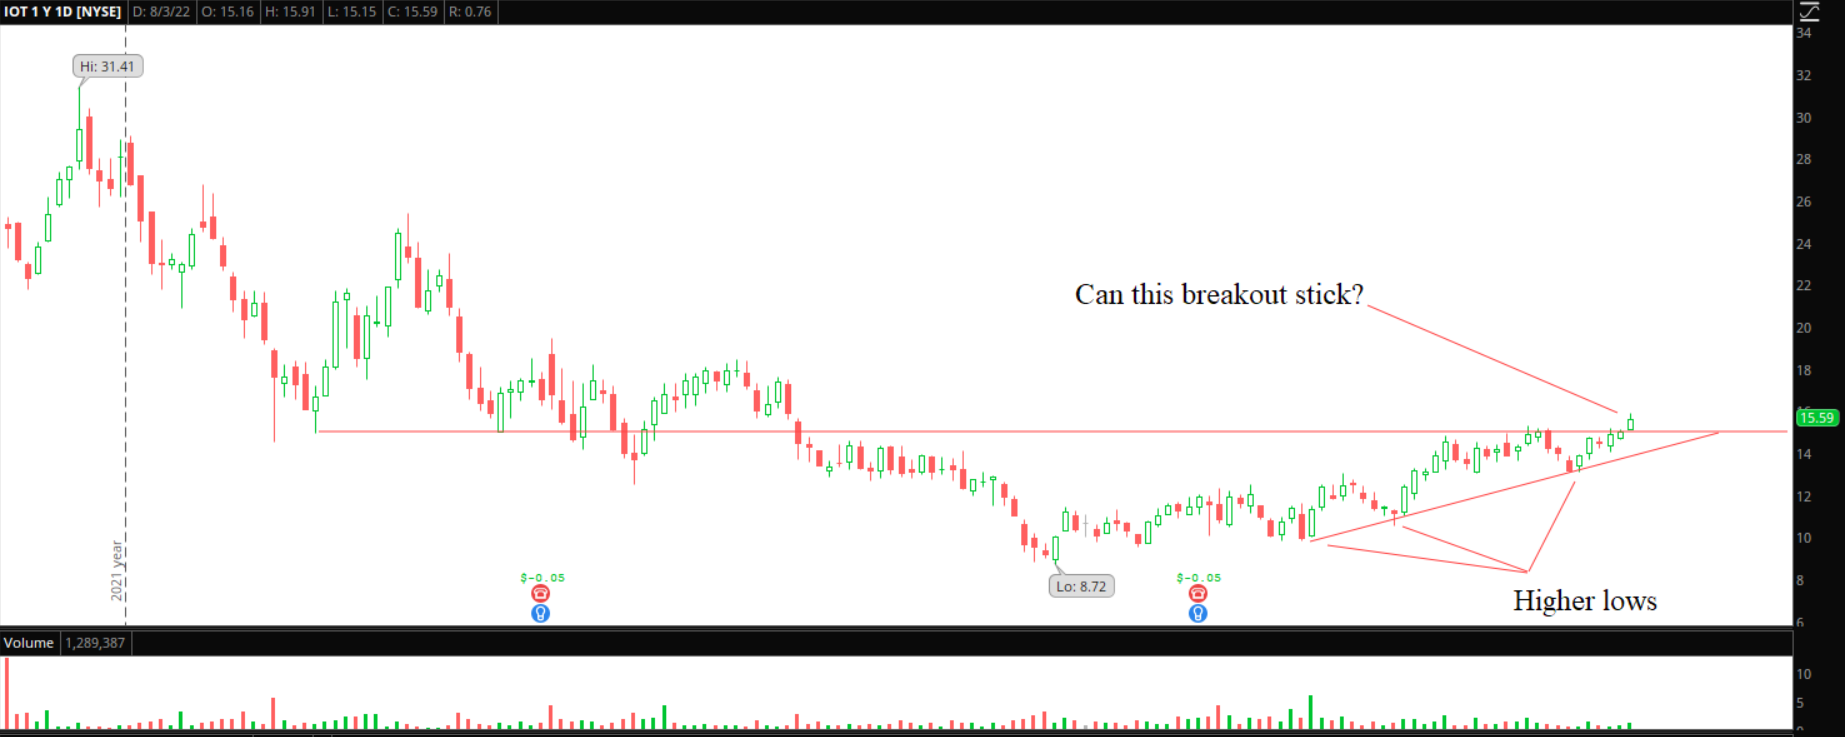
Like most stocks, IOT got taken to the wood shed this year, falling from the high 20’s all the way down to 8.72. But the last several months seem to show a character change. We have 3 higher lows being made with accumulation volume bars starting to show up (these are when the buying days volume is higher then the selling days). Not only that, we have a breakout above the key 15.00 dollar level today (as of 8/3/2022) . As you can see, this line in the sand appears to be important. That's why it is highly recommended by the best stock research websites.
I am a breakout position trader. I focus on fast growing companies coming out of bases. I use a trend trading methodology to trim and trail, letting them run for as long as they want to, so far as they do not violate my sell rules. I keep risk tight and small. As long as IOT is above 15, I like it long. Below, we need to re-evaluate.
Hope this helps put another growing company on your radar for investigation.
As always, stay positive and spread some love.
Nick